
NPS distribution & scoring
AllFeedback automatically calculates and visualizes Net Promoter Score metrics, displaying promoter/passive/detractor breakdowns and distribution charts.
Last updated on Jun 22, 2026
NPS distribution & scoring
AllFeedback automatically calculates Net Promoter Score (NPS) metrics for surveys that include an NPS question. It groups responses into promoters, passives, and detractors, then presents the result as a visual gauge with a category breakdown on the Analytics screen.
What You'll See
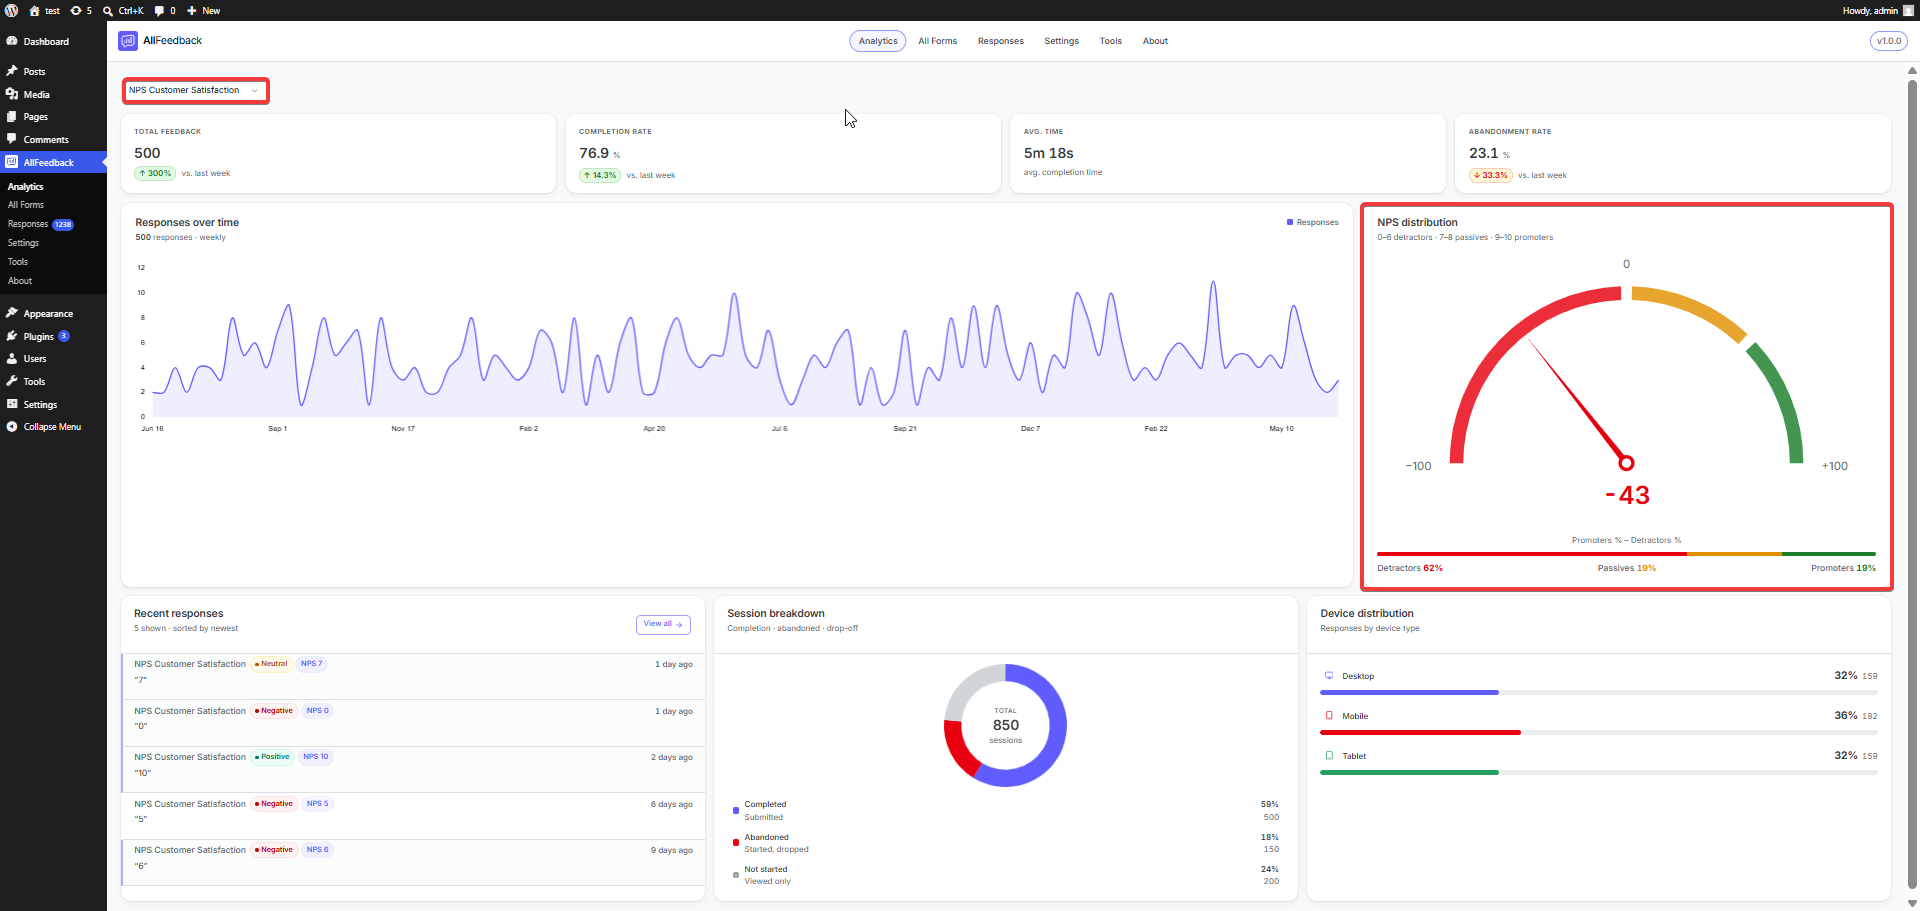
When you view analytics for an NPS survey, AllFeedback displays:
The overall NPS score (a number between −100 and +100)
A gauge with a needle pointing to the score
A percentage breakdown of promoters, passives, and detractors
How NPS Categories Work
AllFeedback groups each scored response into one of three categories based on the 0–10 score given:
Promoters — scores 9–10 (enthusiastic customers likely to recommend you)
Passives — scores 7–8 (satisfied but unenthusiastic customers)
Detractors — scores 0–6 (unhappy customers who may discourage others)
These are the industry-standard NPS groupings and cannot be customized.
Viewing NPS Distribution
Go to wp-admin and navigate to AllFeedback → Analytics
Select your NPS survey from the dropdown at the top of the page
Find the NPS distribution card on the Analytics screen
The NPS distribution card shows:
A gauge spanning −100 to +100, with a needle pointing to your current score and the score printed below it
Fixed colored zones — Detractors in red, Passives in yellow, Promoters in green
A proportional bar and legend beneath the gauge showing the share of each category (for example, "Detractors 62% · Passives 19% · Promoters 19%")
Hover over any category — in the bar or the legend — to see its exact response count and percentage.
Understanding the NPS Score
The NPS score is calculated as:
NPS = ((Promoters − Detractors) ÷ Total Responses) × 100The result is rounded to 2 decimal places. For example, with 100 responses — 30 promoters, 20 passives, and 50 detractors:
NPS = ((30 − 50) ÷ 100) × 100 = −20A positive score means you have more promoters than detractors; a negative score means more detractors than promoters.
"Total Responses" here is the survey's total response count. For a standard NPS survey where every response includes a score, this equals the number of scored responses.
What Gets Included
Responses are sorted into categories by their 0–10 score: 9–10 promoters, 7–8 passives, 0–6 detractors.
Responses without a score (such as text-only answers) aren't placed in any category, but they still count toward the survey's total responses — and therefore the NPS denominator.
When NPS Metrics Appear
The NPS distribution card only appears for surveys that include an NPS-type question. Surveys without an NPS field don't show it at all.
For an NPS survey that hasn't collected any scored responses yet, the card shows a "No NPS responses yet" placeholder until the first response arrives.