
Session metrics
Track and analyze visitor interactions with surveys through session-based metrics that measure views, starts, completions, and abandonment rates.
Last updated on Jun 22, 2026
Session metrics
Session metrics help you understand how visitors interact with your surveys — from the moment they see a survey widget to whether they complete or abandon it. AllFeedback tracks every survey interaction as a session and uses that data to calculate key performance indicators.
What is a session?
A session represents a single visitor's interaction with one survey. When a visitor encounters a survey widget, AllFeedback creates a session record with a unique session ID, then updates it as the visitor progresses — or drops off.
Sessions are stored in the wp_af_survey_sessions table and move through these stages:
Viewed — the visitor saw the survey widget
Started — the visitor began interacting (clicked into a field or selected an answer)
Submitted — the visitor completed and submitted the survey
Abandoned — the visitor closed the survey without submitting, or became inactive for more than 30 minutes after starting
How sessions are tracked
AllFeedback tracks session events in the background as visitors interact with your surveys:
A session record is created in wp_af_survey_sessions when the widget is displayed. Its status is viewed, and started_at is not yet set.
When the visitor begins interacting (clicking into a field or selecting a rating), started_at is recorded and the status changes to started.
As the visitor keeps interacting, the widget sends periodic heartbeat events that update the session's last_active_at timestamp.
If the visitor submits, submitted_at is recorded and the status changes to submitted.
If the visitor explicitly closes the survey without submitting, abandoned_at is recorded and the status changes to abandoned.
If a started session is never submitted and its last_active_at is more than 30 minutes old, it is automatically treated as abandoned in analytics calculations (no stored status change).
Session metrics explained
AllFeedback calculates three key metrics from session data.
Completion rate
The percentage of visitors who started your survey and went on to submit it.
Completion Rate = (Submitted Sessions ÷ Started Sessions) × 100A session counts as started if it has a started_at timestamp, and submitted if it has a submitted_at timestamp.
Example: if 100 visitors started and 77 submitted, the completion rate is 77%. A higher rate means more visitors finish once they begin.
Abandonment rate
The percentage of started sessions that were never submitted.
Abandonment Rate = (Abandoned Sessions ÷ Started Sessions) × 100A session counts as abandoned if either:
abandoned_at is set (the visitor explicitly closed the survey), or
it has a started_at, no submitted_at, and last_active_at is older than 30 minutes
Example: if 100 started, 77 submitted, and 23 abandoned, the abandonment rate is 23%. A lower rate is better.
Average completion time
How long submitted surveys took, from start to submission.
Average Completion Time = average of (submitted_at − started_at) across submitted sessionsOnly sessions that were both started and submitted are included. The Analytics screen shows this in minutes and seconds (for example, 5m 7s).
Where to view session metrics
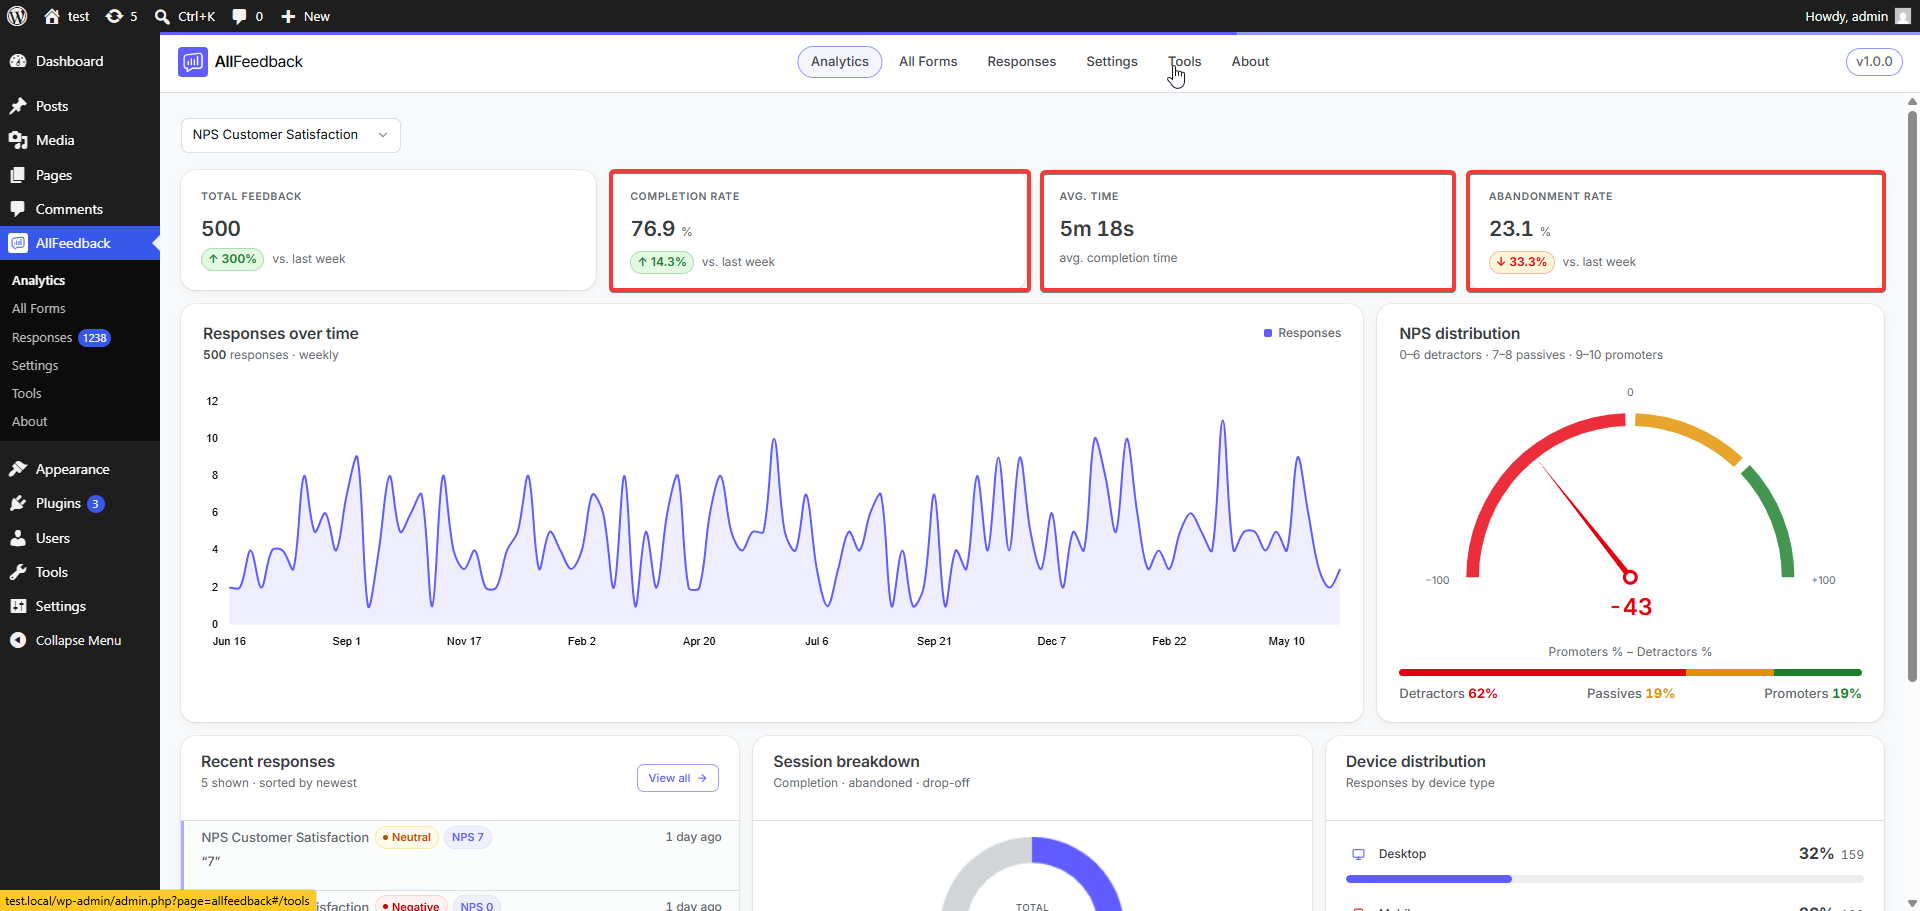
Go to wp-admin → AllFeedback → Analytics
Select the survey you want to analyze from the dropdown at the top
The session-metric cards — Completion Rate, Average Time, and Abandonment Rate — appear near the top of the screen (alongside Total Feedback)
Completion Rate and Abandonment Rate also appear on the combined All forms view; Average Time only appears for a single selected survey.
Reading the change pill: Completion Rate and Abandonment Rate show a small pill comparing the value to the previous week — green ↑ when the value increased, red ↓ when it decreased. The color reflects the direction of change only, not whether it's good or bad — so for Abandonment Rate, a red ↓ is actually a good sign (abandonment fell). Average Time shows just its value, with no week-over-week comparison.
Session breakdown and device distribution
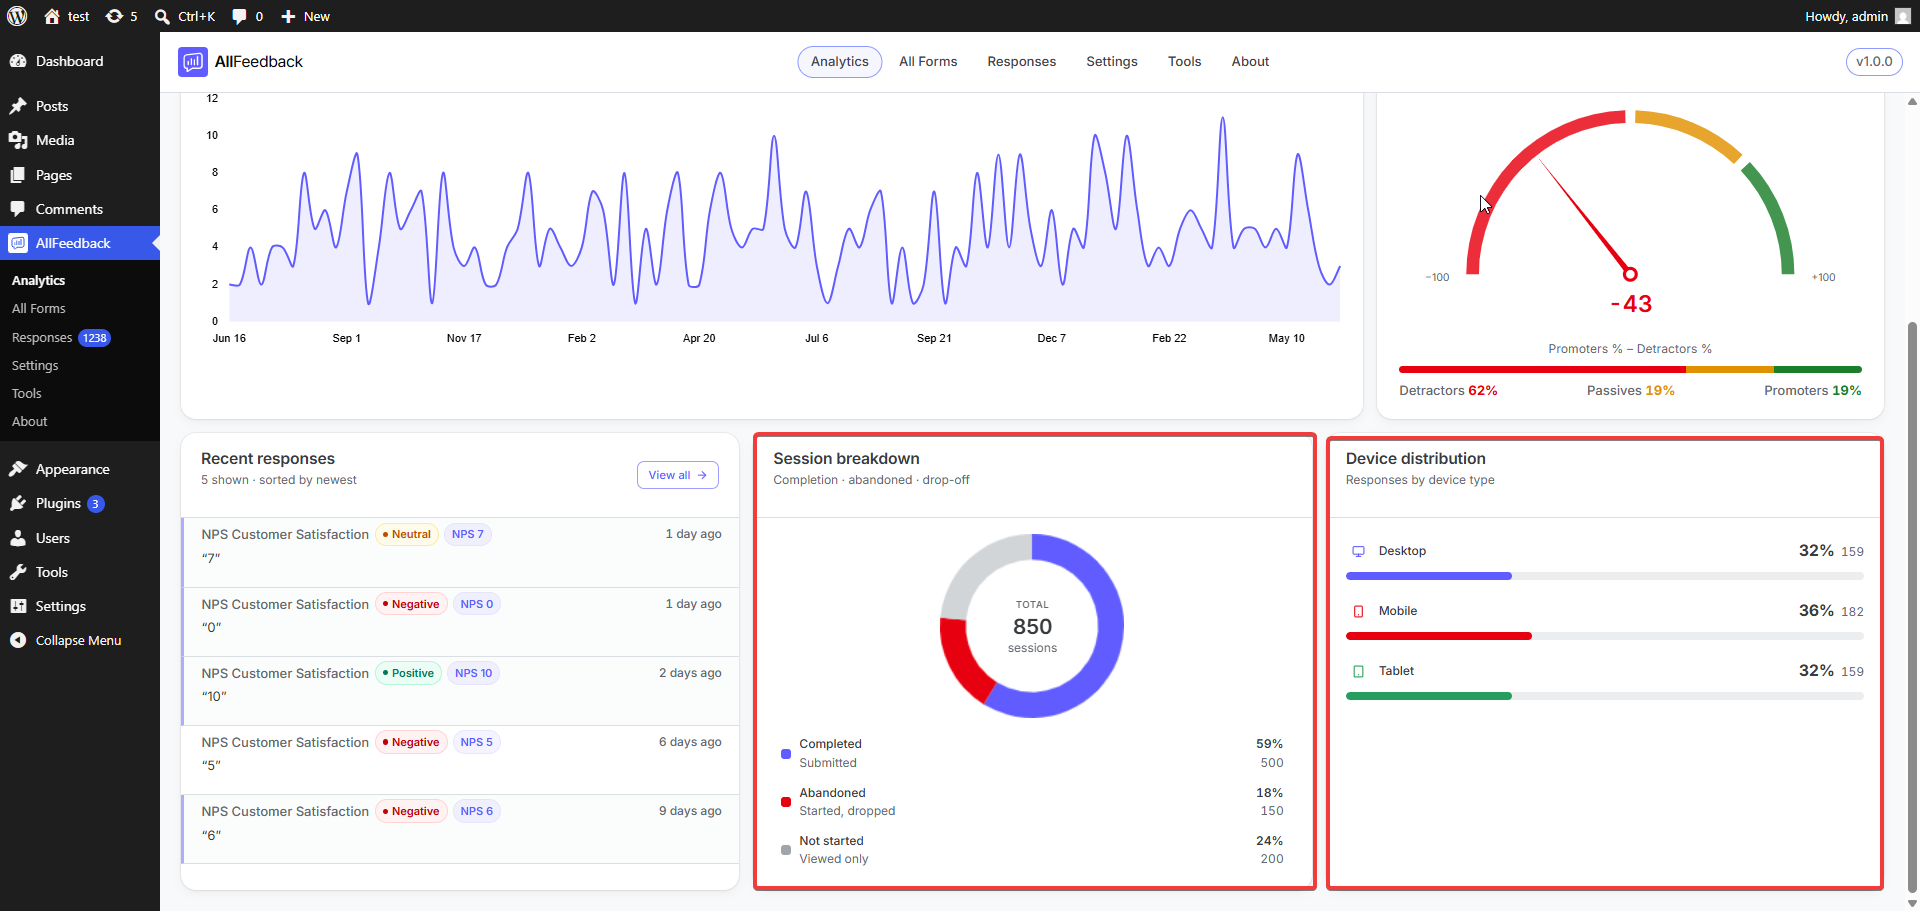
When you select a single survey, the Analytics screen also shows a Session breakdown doughnut and a Device distribution card.
Session breakdown groups every session for that survey into three outcomes, with the total session count in the center:
Completed — started and submitted
Abandoned — started but never submitted
Not started — the widget was seen but the survey was never started
Device distribution shows how many responses came from each device type — Desktop, Mobile, Tablet, or Unknown (when the device type couldn't be detected). Device type is recorded in the wp_af_responses table when a visitor submits.
Rate limiting and data accuracy
To prevent abuse and keep data accurate, AllFeedback rate-limits session event tracking: each session may send at most 60 events per 5-minute window. Excess events are silently ignored — the visitor never sees an error, and the extra events simply aren't recorded.
Developers can adjust this with the allfeedback_analytics_rate_limit filter, but the default is sufficient for typical interactions.
Technical details
Session data lives in the wp_af_survey_sessions table. Each record includes:
A unique session ID generated by the visitor's browser
The survey ID the session belongs to, plus the visitor's user ID (or guest token)
Timestamps for when the session was created (the initial view), started, last active, submitted, and abandoned
The current status (viewed, started, submitted, or abandoned)
Session events (viewed, started, abandoned, heartbeat) are sent from the visitor's browser to the server through the AllFeedback REST API; the server validates each event and updates the record. Metrics are then aggregated from this table in real time whenever you load the Analytics screen — producing the completion rate, abandonment rate, and average completion time.